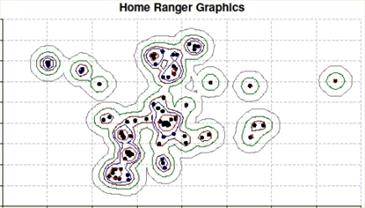
Turtle M9(female) for 2009 to 2011. Primary Activity Area 8.26 acres, and her short term forrays to the meadow nesting area are clearly seen. M9 was killed by a vehicle as she was crossing the road while returning from a nesting forray to her primary activity area in 2016.
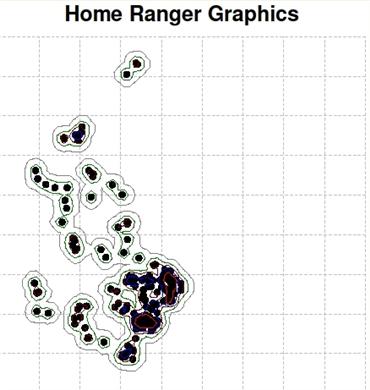
Turtle M11 for 2009 to 2011
Kernal home range contours for Turtle M9. Although it appears to be representative, easily accessed locations were GPS'ed more often than others. The graphic would change if GPS locations were recorded at consistant, regularly spaced time intervals.
Kernal home range contours for Turtle M11. This turtle spends much more of the season in the open meadow than in the woods, but the meadow is much more difficult to access and track compared to the forest.
All iButtons (soil temperatures for all Hib locations) for the winter of 2011-2012 graphed together. The spikes at the left and right on the chart are pre-hibernation and post-emergence temperature recordings (these are false readings due to the sunlight striking the iButton). Hibernation soil temperatures trend similar reguardless of the site location and exposure. All seasons iButton, Air and Soil temperatures logged are charted lokking for inconsistancies.
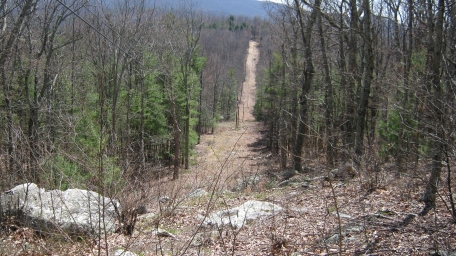
This road is the greatest hazard to this turtle population. Most turtle crossings occur between daybreak and 8:30 a.m. or so, during the hours of relatively light traffic. But over their lifetime an individual may make 120 or more crossings. That's a lot of exposure to inattentive drivers, large multi-wheel vehicles, and sociopathic, redneck people.
This section of the power line ROW is on private land and is maintained the cheapest way possible: by removing all vegetation increasing the number of years between maintenance. This ROW is regularly traveled by turtles M15, M19 and once annually by M1.
Generally, my opinion of ROW's as barriers to wildlife has changed over the years. In otherwise continuious forest cover, artificial meadow and forest edge created by mechanical clearing provides diversity prefered by many species, and little or no barrier to all but a very few species.
This page is for things that don't seen to fit elsewhere, and a temporary storage for interesting information.
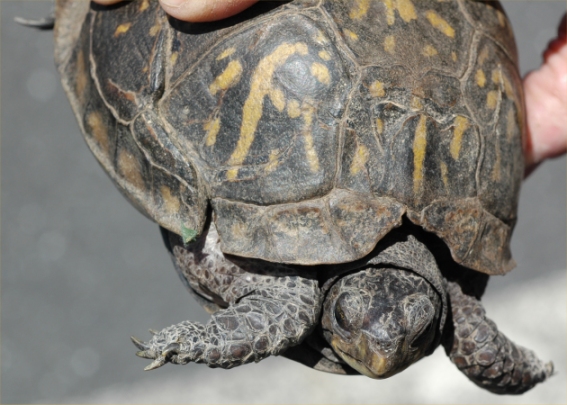
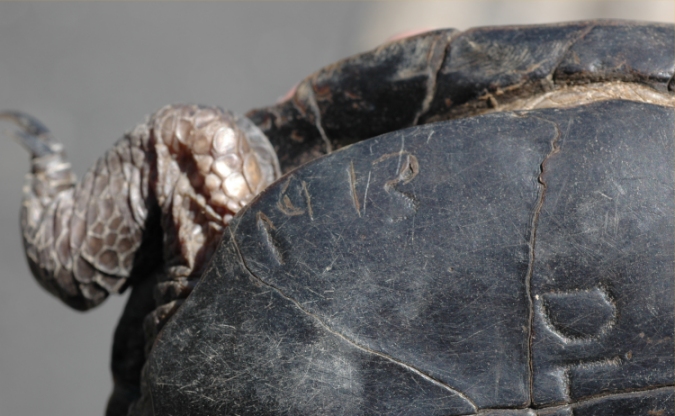
1913 Box turtle: In 2010, this Box turtle was found in a valley location approximately 20 miles from this study area. The 1913 carved date was confirmed as authentic. No one yet knows the indentity of the persons initials who did the carving. If the turtle was 20 years old when the date was carved into it's plastron, that would make it's age well over 123 years. The turtle was released back at the forest site where found.
Although this turtle was taken to the state wildlife office, and photos were taken for the local newspaper, no weight or measurements were taken. No radio tag was attached. Another opportunity lost!
Turtle Finding Chart
In this study area, most new turtle finds were as a result of tracking a previously tagged turtle.
Turtles M1 and M2 were found crossing the road and tagged. In the diagram M3 was found (in 2009) while tracking M1, and M21 was found while tracking M3, and M24 was found while tracking M21. The red numbers represent females.
The number of annual new turtle finds seems encouraging, but compared with the number of tagged turtles found with tracked turtles, the numbers still suggest that there are only about 40 total turtles remaining in this local population.
Successfully finding new turtles using ground searches in a study area of this size (and a population density this small) would be literally an impossible task.
These are Excel workbooks in Excel 97 format complete with raw data, charts, and hibernation location photos
Terrapene carolina carolina
A Relict Population Doomed To Extinction?